


Most plants believe they know what quality costs. They know the inspection headcount and the scrap report. They usually do not know the cost of the rework loop, the expedited freight, the engineering hours spent on a customer complaint, or the margin lost when a program is not renewed. Manufacturing quality costs are far larger than the visible line items, and the 1:10:100 rule is the simplest way to show where they accumulate.
Table of Contents
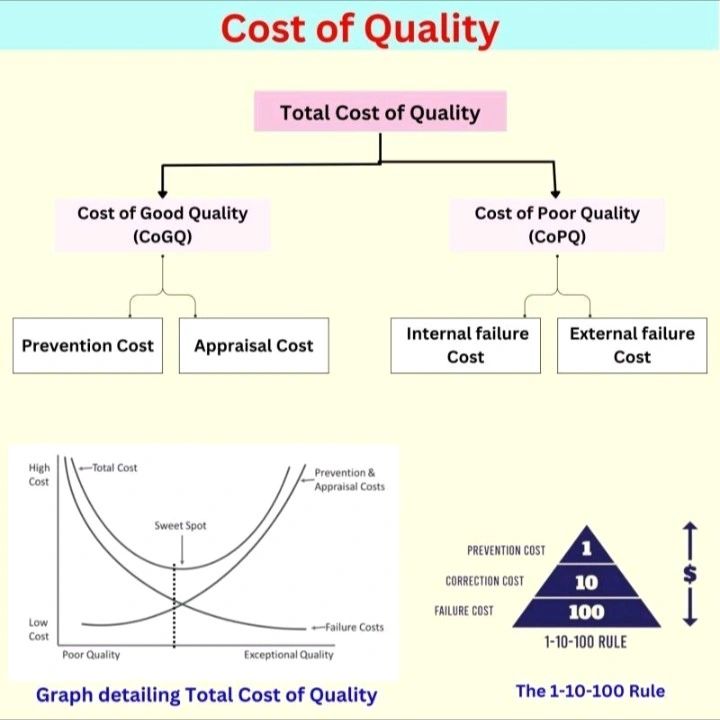
The rule itself is a ratio. One dollar spent preventing a defect avoids roughly ten dollars of appraisal and correction, and roughly one hundred dollars of failure at the customer. The numbers are illustrative, not universal, but the shape of the curve is remarkably consistent across industries.
What the 1:10:100 Rule Says
The 1:10:100 rule states that the cost of correcting a problem grows by an order of magnitude at each stage it survives. A design review that catches an error costs engineering time. A trial run that catches the same error costs tooling changes and schedule. A customer that catches it costs returns, containment, freight, and reputation.
Manufacturing quality costs therefore behave like debt. Spend early and the amount is small. Defer the spend and the interest compounds. The uncomfortable part is that deferral looks like savings in the month it happens, which is why it survives so long in organisations that measure only monthly cost.
The rule also explains why quality initiatives fail when they are framed as inspection improvements. Adding inspectors increases appraisal cost and catches defects later, at the ten-dollar stage. Reducing the defect at the source is the only intervention that moves the total.
The Four Categories of Quality Cost
Prevention. Training, DFM reviews, process capability studies, supplier qualification, calibration, and design verification. These are the cheapest dollars in the model and the first to be cut in a downturn, which is precisely backwards.
Appraisal. Incoming inspection, in-process checks, final inspection, test, and audit. Necessary but non-value-adding. A plant that grows this category year after year is treating symptoms.
Internal failure. Scrap, rework, sorting, downtime caused by quality, and the engineering time spent on containment. This is where most manufacturing quality costs hide, because rework is absorbed into standard hours and never appears as a separate line.
External failure. Returns, warranty, field service, recalls, expedited freight, credits, and the commercial cost of a damaged relationship. The smallest category by transaction count and the largest by impact.
A useful discipline is to report all four together, every month, against the same denominator: cost of goods sold, or revenue, or units produced. A plant that reports scrap alone will optimise scrap and ignore the rework that replaced it.
How to Measure Manufacturing Quality Costs
Start with what already exists in the accounting system: scrap value, rework labour, inspection labour, calibration, warranty reserves, and freight claims. Most of those numbers are already captured, just not aggregated. The first cost-of-quality report is usually an exercise in joining spreadsheets, not in installing software.
The harder part is the invisible labour. Engineering hours spent on a supplier issue, production time lost to a stop-and-sort, and the planner’s afternoon spent re-sequencing a schedule after a rejection are real costs that nobody books to quality. A simple time-category code on the shop-floor and engineering timesheets captures most of it within a month.
Then apply a simple rule for anything unmeasurable: estimate conservatively, label the estimate, and refine it next quarter. A cost-of-quality number that is directionally right and published monthly changes behaviour. A perfect number published once a year does not.
Where the Money Actually Hides
Rework absorbed into standard time. If the router allows ten minutes of touch-up, the plant is paying for the defect in every quote and calling it labour efficiency. Manufacturing quality costs of this type can exceed scrap value and are almost never reported.
Sorting at the customer. A stop-and-sort at the customer’s dock multiplies the labour rate, adds travel, and often triggers a chargeback. The defect itself may be trivial.
Expedited freight. A quality escape that delays a shipment converts into air freight. That cost lands in logistics, not quality, which is why the quality report looks better than reality.
Engineering time. Every hour an engineer spends on containment is an hour not spent on the next program. The opportunity cost rarely appears anywhere.
Lost programs. The largest external failure cost is the business that is not quoted again. It never appears in a cost-of-quality report because the counterfactual is invisible.
Inventory buffer. Plants with low process capability hold extra stock to protect delivery. The carrying cost is a quality cost wearing a finance label.
A Worked Example
Take a moulded housing with a critical boss dimension. The plant inspects 100 percent at final assembly, one operator per shift, at a loaded cost of 30 dollars per hour. That is roughly 90 dollars per day, or about 27,000 dollars a year on a single-shift basis, before any scrap is counted.
Now suppose the boss dimension drifts because the tool cooling on that station is marginal. Scrap runs at two percent and rework at three percent, and a returned lot once a quarter costs 8,000 dollars in freight and sorting. Manufacturing quality costs for this one feature are now approaching six figures a year.
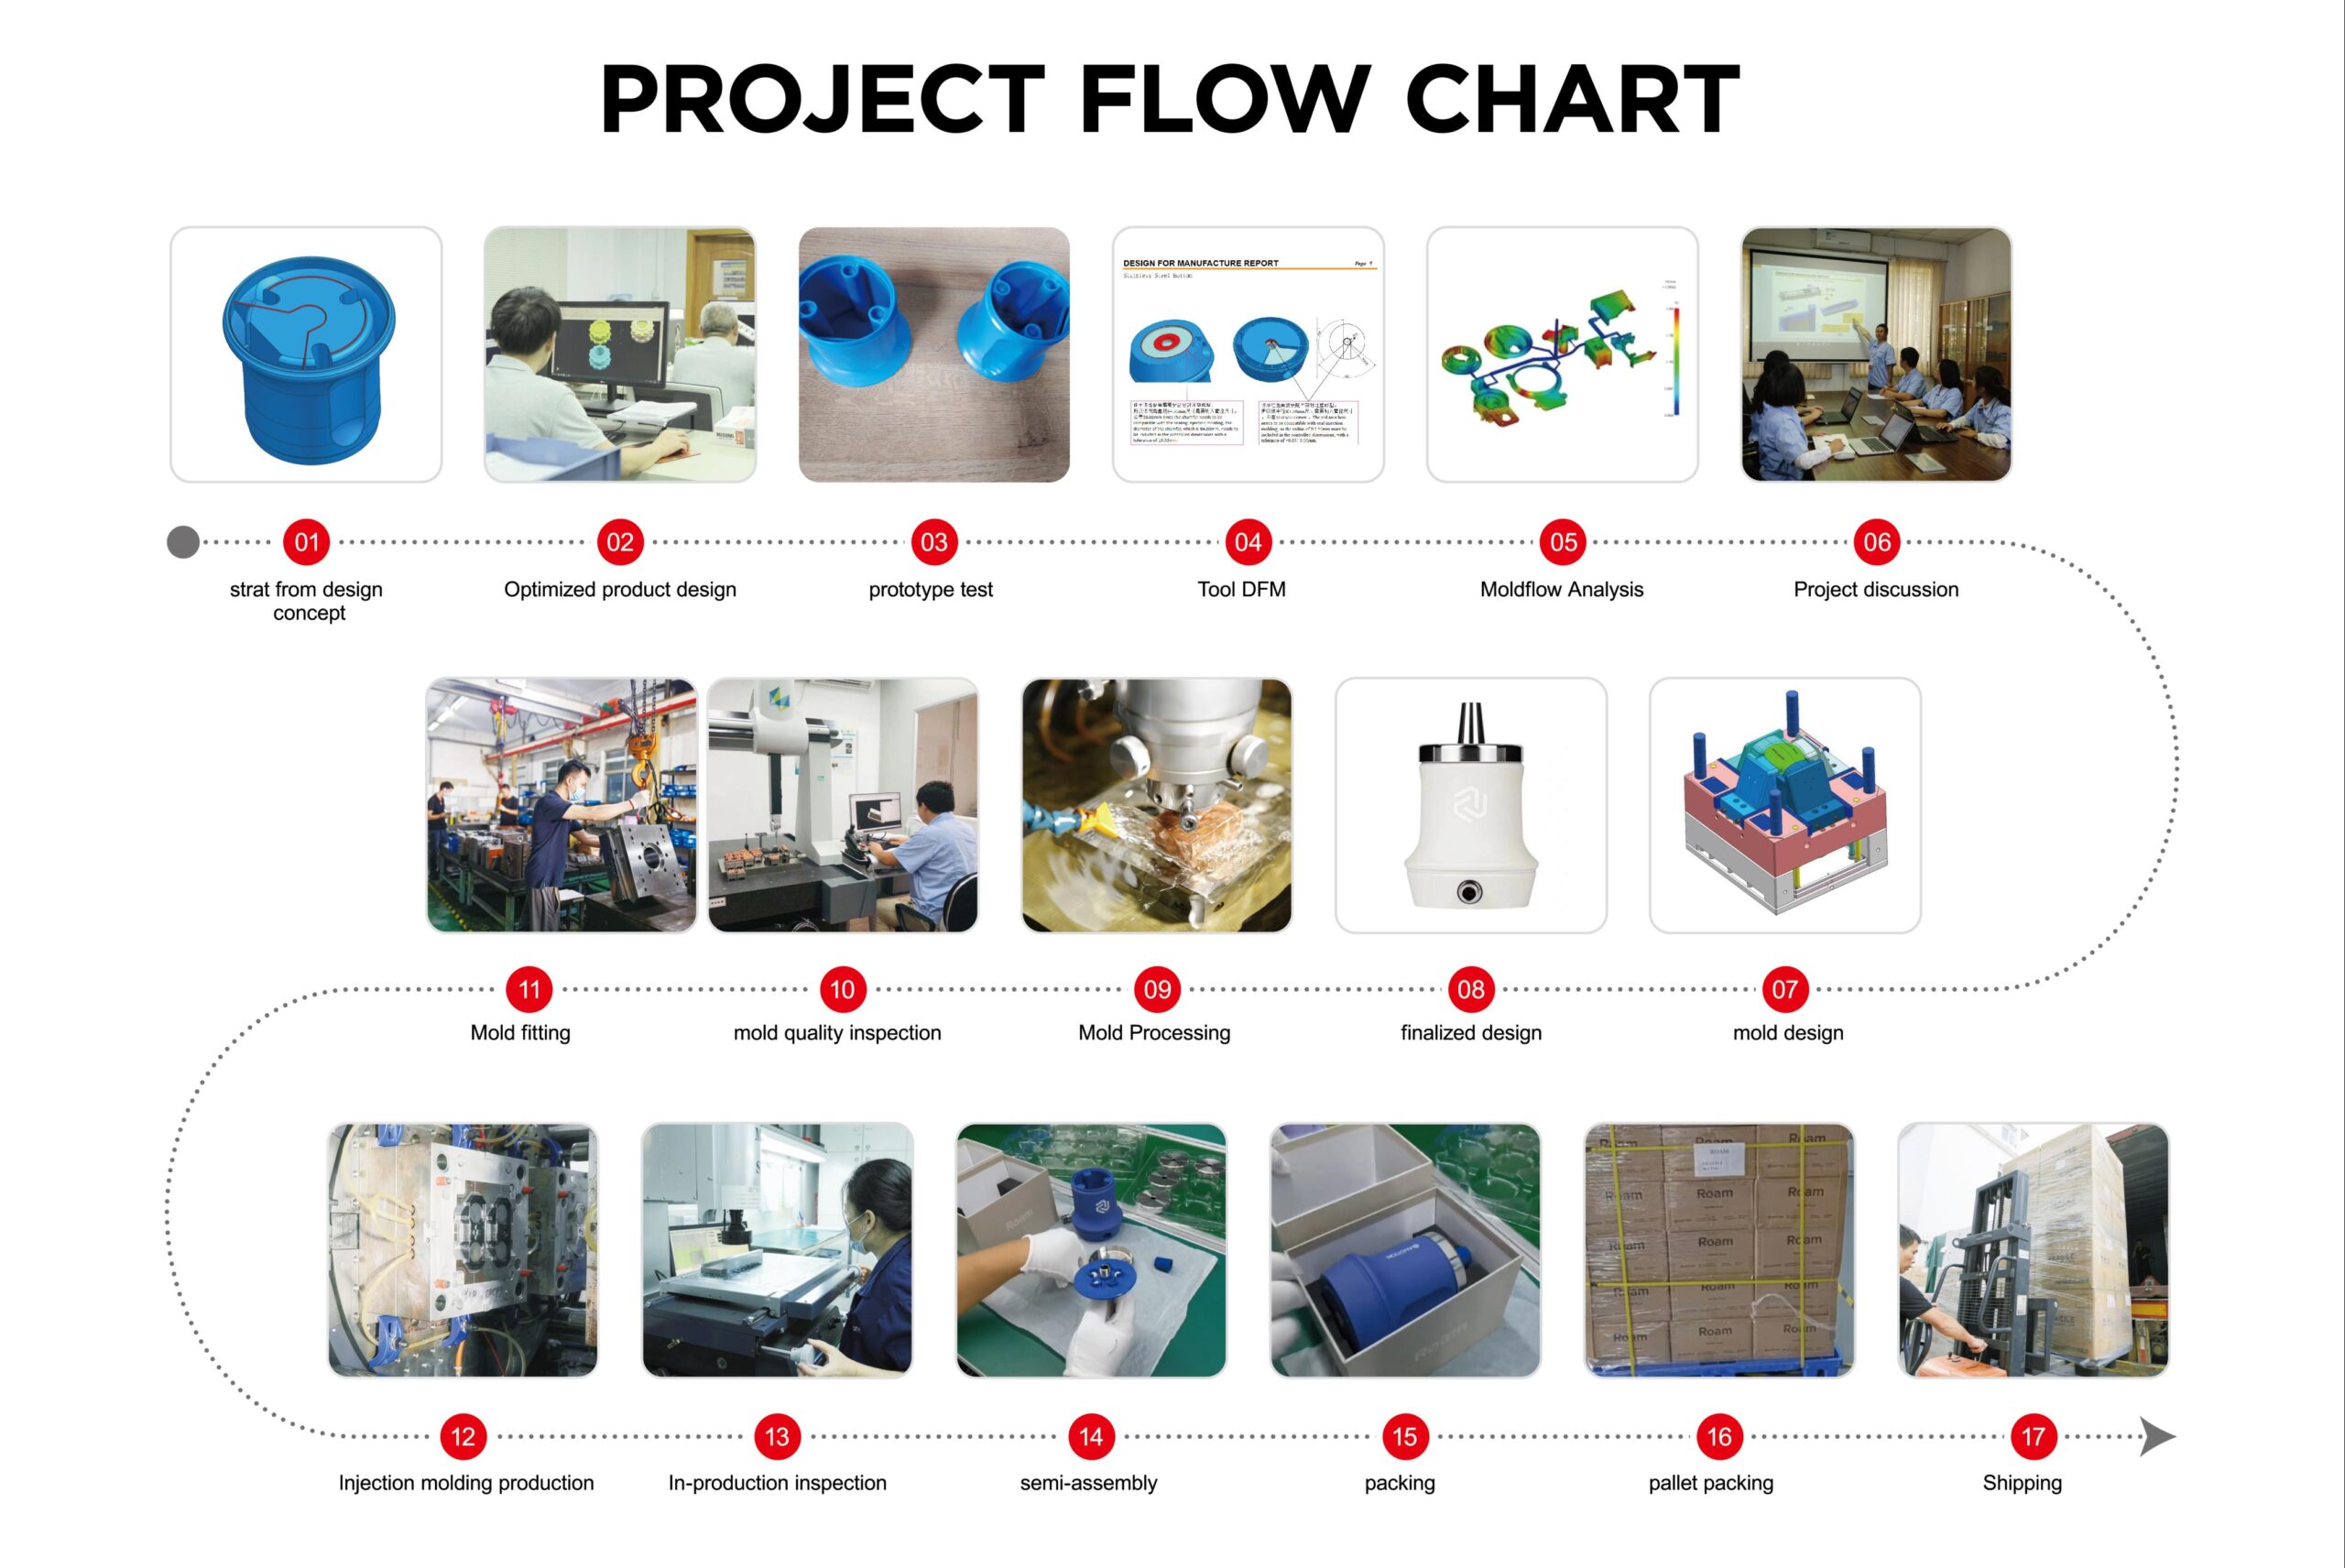
A cooling change in the tool might cost 4,000 dollars. A capability study and a documented parameter window might cost a week of engineering. Both sit at the one-dollar end of the rule, and both eliminate most of the appraisal and failure spend. The arithmetic is not subtle; the obstacle is that the 27,000 dollars is in the budget as a permanent line and the 4,000 dollars is a request.
That asymmetry is the core problem in managing manufacturing quality costs. Prevention is a project with an approval, and failure is a cost of doing business. Reframing the failure as a project is usually the whole intervention.
What It Means for Sourcing Decisions
Sourcing teams compare unit prices and rarely compare cost of quality. A supplier quoting five percent less but running at two percent defect escape is more expensive than the incumbent, once sorting, freight, and engineering time are counted. The comparison is only visible if the buying organisation tracks external failure cost by supplier.
That tracking changes negotiations. Instead of arguing about price, the conversation becomes about total landed cost, and the supplier with a capable process can defend a higher unit price with data. Manufacturing quality costs become a shared metric rather than an internal complaint.
It also changes supplier selection. A plant that can show prevention spending, capability data, and a falling failure trend is buying down your risk. A plant that competes only on price is transferring it. Our guide to quality management maturity sets out how to assess that difference on a plant visit.
Building a Cost-of-Quality Program
1. Define the four categories in your own language. Use the account codes your finance team already has, plus two new ones for rework labour and quality-driven engineering time.
2. Pick one product line and one quarter. A pilot produces a number and a method. A company-wide launch produces an argument about definitions.
3. Report monthly and in absolute currency. Percentages hide growth. A dollar figure next to a rising trend line gets attention.
4. Rank problems by failure cost, not by defect count. The defect that costs the most is often not the most frequent one, and it is almost never the one the plant is currently chasing.
5. Fund prevention from the failure budget. Take a visible slice of the rework and warranty spend and move it to a project with a measured target. Repeat.
6. Verify the saving. Re-measure the same line after the change. Programs that skip this step keep funding projects that do not work.
None of this requires new software. It requires one owner, a monthly meeting, and the discipline to keep the categories stable so the trend is comparable.
How the Ratio Changes by Industry
The 1:10:100 rule is directionally universal, but the multipliers move. In medical devices and automotive safety parts, external failure includes regulatory and liability exposure that dwarfs the hundred-dollar figure. In consumer packaging, the failure cost is dominated by returns and retailer chargebacks.
High-volume assembly tends to have low unit failure cost but very high volume, so a small escape rate becomes a large absolute number. Low-volume capital equipment has the opposite profile: few units, but each failure carries service travel and downtime at the customer. Both cases raise manufacturing quality costs well above the internal scrap report.
Regulated industries also carry a documentation cost that the rule does not capture. A traceability system, a validation file, and a design history are prevention spending by another name, and they are not optional. Comparing manufacturing quality costs across industries without that context produces misleading benchmarks.
The practical conclusion is to build the ratio from your own data rather than importing it. Measure one product family for a quarter, calculate the actual multipliers from prevention to failure, and use those numbers for the next investment decision.
A Simple Reporting Template
One page is enough. The left column lists the four categories with the account codes that feed them. The next column shows the current month, the next the year to date, and the final column shows the same period last year. At the bottom, one line shows total manufacturing quality costs as a percentage of revenue.
Beneath the table, three lines of commentary: the largest single failure driver this month, the prevention project currently funded, and the measured result of the last one. That structure keeps the report from becoming a list of complaints and forces a link between spending and outcome.
The template also makes benchmarking honest. Two plants comparing manufacturing quality costs with the same categories and the same denominator can have a useful conversation. Two plants comparing scrap percentages cannot.
Finally, publish it where the shop floor can see it. Manufacturing quality costs expressed in currency per week land harder than a defect rate, and the operators who influence the number are usually the last to be shown it.
A final word on ownership. Manufacturing quality costs fall between departments by default: quality owns the inspection line, production owns the scrap, finance owns the warranty reserve. Naming one owner for the whole number is the single change that turns four isolated reports into a managed figure.
Frequently Asked Questions
Is the 1:10:100 rule exact?
No. It is a planning heuristic that describes the order of magnitude between catching a defect at design, at production, and at the customer. Real ratios vary by industry and by defect type.
What percentage of revenue should quality cost?
Mature manufacturers often report total quality cost between two and four percent of revenue, with prevention and appraisal making up a growing share. Much above that suggests failure costs are being absorbed rather than managed.
Should scrap be counted at material cost or at selling price?
Count it at the cost of the resources consumed, including machine time and labour, and show the lost margin separately. Counting at selling price inflates the number and invites disbelief.
The Bottom Line
Manufacturing quality costs are mostly invisible until someone decides to look, and the 1:10:100 rule explains why looking early is so much cheaper. Measure the four categories, find the failure that costs the most, and move a visible slice of that budget into prevention.
For background, the cost of poor quality reference covers the accounting models, and our guide to quality control in precision injection moulding shows how the prevention side looks on a real shop floor. For tooling programs, injection moulding hidden costs covers the failure modes that appear before mass production.